
Score8 · Statistics
Football Statistics
Football statistics are numbers that describe what happens in matches — who had the ball, who shot, how often and from where. This page defines the most common statistics and how to read them in context.
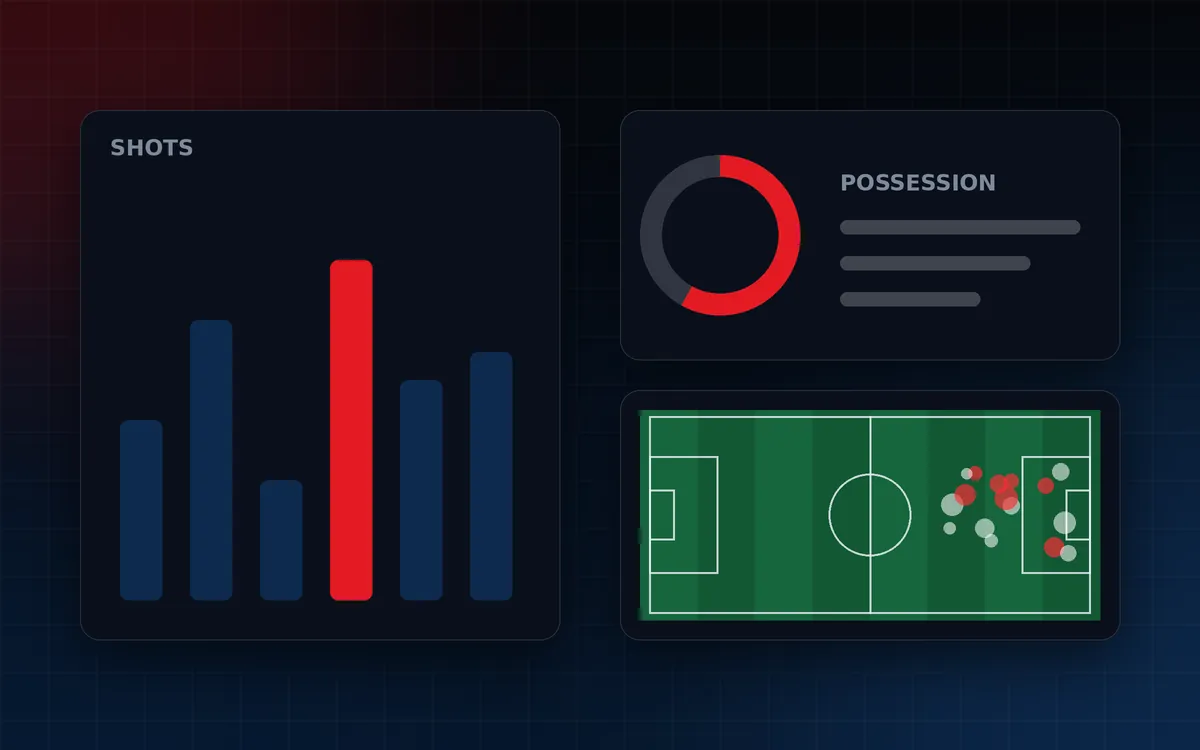
Common football statistics
Possession
Possession is the share of the match in which a team has the ball, usually shown as a percentage for each side adding up to 100%. It shows who controlled the ball, not necessarily who created better chances; teams that are leading often give up possession deliberately.
Shots and shots on target
A shot is any attempt to score. A shot on target would have gone in without a save or a last-ditch block by a defender. Shots that hit the woodwork are usually not counted as on target. Shots show volume; shots on target show accuracy.
Goals
A goal is scored when the whole ball crosses the goal line between the posts and under the crossbar, without an infringement. Own goals count for the opposing team.
Assists
An assist is the final pass or action that leads directly to a goal. Data providers apply slightly different rules to deflections and rebounds, so assist totals can differ between sources.
Passes and pass completion
Passes count attempts to play the ball to a teammate; pass completion is the percentage that reach one. High completion can mean safe, short passing as much as quality.
Cards
A yellow card is a caution; two in one match lead to a red card. A red card sends a player off, and the team plays the rest of the match with one fewer player.
Corners
A corner is awarded when the ball goes out over the goal line having last touched a defender. Corner counts show pressure, but many corners produce no clear chance.
Expected goals (xG)
Expected goals (xG) estimates the probability that a shot becomes a goal, based on how often similar shots have been scored. A 0.3 xG chance is scored about three times in ten. Summed over a match, xG describes chance quality. Different providers use different models.
Form
Form is a team's recent sequence of results, usually the last five or six matches, shown as W, D and L. It is a snapshot, not a prediction.
Reading statistics well
- Compare both teams, not single numbers in isolation.
- Consider game state: leading teams defend more, trailing teams attack more.
- Use several matches before drawing conclusions.
- Statistics describe the past; they do not guarantee future results.